A churn rate calculator comes down to one formula: lost customers divided by total customers at the start of the period, multiplied by 100. If you want the fast answer, the interactive calculator below helps you plug in your Shopify numbers right away so you can see whether your store is growing or just replacing customers who no longer buy.
A lot of Shopify owners hit the same wall. Orders are coming in, ad spend is working well enough, Klaviyo flows are firing, and the top line looks active. But when you step back, the business feels stuck. You're acquiring customers, yet the customer base doesn't seem to deepen the way it should.
That's usually a churn problem.
In ecommerce, churn doesn't always look like a formal subscription cancellation. Sometimes it shows up as one-time buyers who never place a second order, customers who vanish after a discount-driven first purchase, or repeat buyers who slowly go inactive. If you don't measure that leak, you'll keep pouring money into acquisition without knowing how much of it is building durable profitability.
Table of Contents
- Why Your Ecommerce Store Needs to Measure Churn
- The Essential Churn Formulas Every Store Needs
- Your Interactive Ecommerce Churn Rate Calculator
- Going Deeper With Advanced Churn Analysis
- How to Interpret Your Churn Rate and Avoid Common Pitfalls
- From Calculation to Action 5 Ways to Reduce Ecommerce Churn
Why Your Ecommerce Store Needs to Measure Churn
If your store keeps adding new customers but profit still feels fragile, churn is usually the missing metric. Sales can rise while customer loyalty stays flat. That creates the classic leaky bucket problem: marketing keeps filling the top, while customers slip out the bottom.
For a Shopify store, that leak hits more than retention. It affects how hard your paid traffic has to work, how valuable your email list really is, and whether your repeat purchase strategy is doing anything beyond sending more campaigns. When owners only track orders, they miss the difference between temporary demand and durable customer value.

Churn matters even if you don't run subscriptions
A lot of churn advice comes from SaaS, but the logic still applies to ecommerce. The only difference is definition.
For a subscription brand, churn is obvious. A customer cancels. For a standard Shopify store, you need to define the moment a buyer becomes inactive. That could be after they miss their normal reorder window, fail to place a second order, or stop buying within the period that usually predicts retention in your category.
Practical rule: If you can't define when a customer is no longer active, you can't measure whether your acquisition spend is creating a healthier business.
That's why I push store owners to track churn alongside repeat purchase behavior. It forces you to stop thinking only in terms of “How many orders did we get?” and start asking “How many customers are staying with us?”
What churn changes in day-to-day decisions
Once you start measuring churn, several decisions get clearer:
- Paid media decisions: You can see whether Meta or Google campaigns are bringing in buyers who stick, or just bargain hunters.
- Email strategy: You can judge whether your flows support a second purchase, not just the first.
- Site experience fixes: Friction on mobile often shows up later as weak retention, which is why improving mobile user experience for ecommerce stores matters more than many owners think.
- Offer strategy: Deep first-order discounts can inflate acquisition while subtly training customers not to return without another deal.
Churn turns retention from a vague goal into something operational. Once it has a number attached to it, you can manage it.
The Essential Churn Formulas Every Store Needs
The math behind a churn rate calculator is simple. The hard part is using the right definition and not confusing customer loss with revenue loss. Ecommerce stores need both views.
Start with customer churn. Then add revenue churn so you can spot whether the buyers leaving are low-value one-time customers or some of the people who support margin.
Customer churn in plain English
The standard formula is:
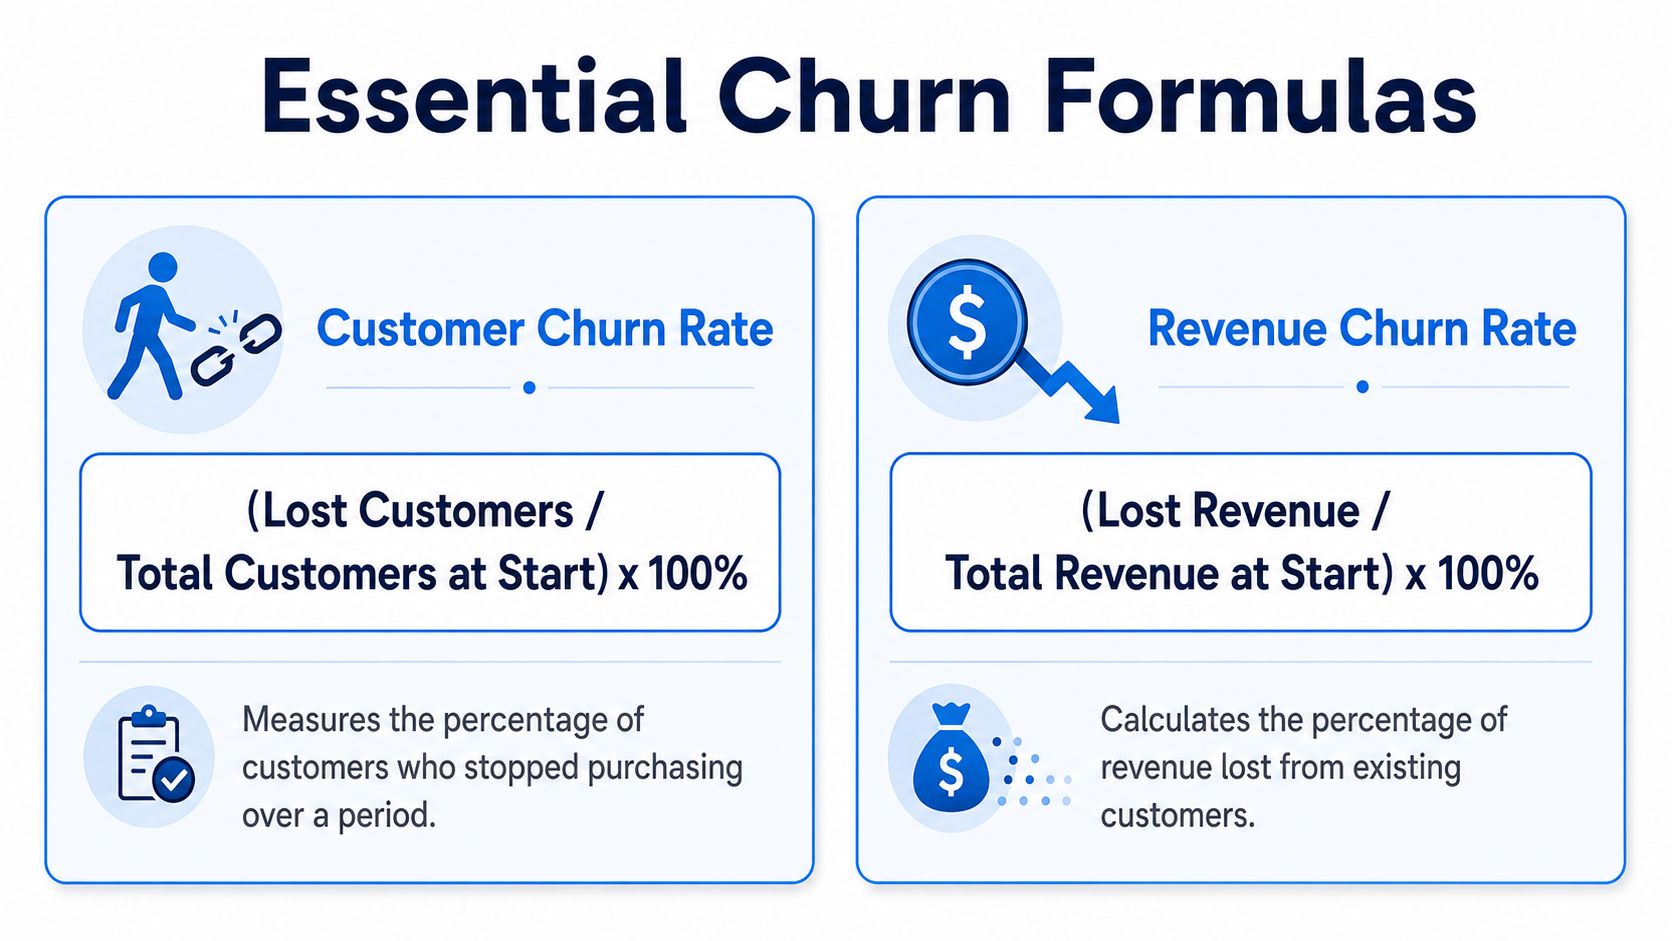
Customer Churn Rate = (Total Lost Customers / Customers in the Time Period) × 100
In practice, the denominator is typically the number of customers at the start of the period. Recurly's explanation of the formula gives a clean example: if a business starts the month with 500 customers and loses 50, its monthly churn rate is 10% (Recurly churn formula example).
For a Shopify store, this works best when you define “lost customer” in a way that fits your buying cycle. A coffee subscription brand can measure monthly. A skincare store might track quarterly. A furniture store probably needs a much longer window because customers don't buy on a fast cadence.
Here's the key trade-off. If your window is too short, you'll overstate churn. If it's too long, you'll spot retention issues too late to fix them.
A simple ecommerce example:
- You start the month with active customers from your retained buyer pool
- Some don't come back within the period you consider normal
- Those become your lost customers for churn tracking
That gives you a baseline retention health score, not just a pile of order data.
A useful companion read on the distinction between customer and revenue churn helps clarify why count-based churn and money-based churn often point to different problems.
A quick video can help if you want the concept explained visually:
Revenue churn tells a different story
Customer churn tells you how many buyers you lost. Revenue churn tells you how much money left with them.
The core revenue version uses this formula:
Revenue churn rate = (Revenue Lost to Churn / Total MRR in the Period) × 100
That wording comes from recurring-revenue businesses, but the logic is useful in ecommerce too. Instead of asking only “How many customers disappeared?” you ask “How much revenue did those customers represent before they dropped off?”
Not all churn hurts equally, a key point.
Losing a cluster of low-intent discount buyers may not hurt much if your stronger repeat purchasers stay active. But if a smaller group of high-value returning buyers stops purchasing, your business can feel weaker even when customer churn looks manageable.
Revenue churn is often the reality check. It shows whether the customers leaving are replaceable or whether they were carrying more of the business than you realized.
For stores with replenishable products, memberships, subscriptions, or strong reorder behavior, revenue churn often becomes the more practical metric. It connects retention directly to profitability.
Simple spreadsheet formulas you can use today
If you want to calculate churn in Google Sheets or Excel, keep it basic.
| Metric | Spreadsheet formula | What it does |
|---|---|---|
| Customer churn rate | =(Lost_Customers/Customers_At_Start)*100 |
Returns the percentage of customers lost in the period |
| Revenue churn rate | =(Lost_Revenue/Revenue_At_Start)*100 |
Returns the percentage of revenue lost from churned customers |
You can also structure it with cell references:
- Customer churn:
=(B2/A2)*100 - Revenue churn:
=(D2/C2)*100
Where:
- A2 = customers at start
- B2 = customers lost
- C2 = revenue at start
- D2 = revenue lost
Use one tab for monthly tracking and another for cohorts or channel segments later. Don't overbuild this at the start. A clean sheet beats a complicated dashboard that nobody updates.
Your Interactive Ecommerce Churn Rate Calculator
If you searched for a churn rate calculator, you probably want your number now, not after building a reporting system. That's exactly how this should work. Enter the basics, get the answer, then decide what to investigate next.
A practical store calculator usually needs three inputs:
- Customers at start of period
- Customers at end of period
- New customers acquired during period
From there, you can estimate how many customers were lost and calculate your customer churn rate. You can also see net customer growth, which is useful because some stores “grow” on the surface while losing too many existing buyers underneath.
What to enter into the calculator
Keep the period consistent. If you use a month, all three inputs should reflect that same month.
Your lost customer count is usually inferred like this in practice:
- Start-of-period customers
- Plus new customers acquired
- Compared against end-of-period customers
That helps you isolate how many customers fell out during the window.
A churn rate calculator is only as useful as the definition behind it. If your store changes the inactivity window every month, the output won't guide decisions.
If you like experimenting with calculators and interactive lead tools more broadly, you can explore GenZform's calculator offerings for examples of how businesses package simple self-serve tools.
Where Shopify store owners usually pull the numbers from
Most merchants can pull these numbers from Shopify customer reports, order exports, subscription app dashboards, or their email platform segments. The exact source matters less than consistency.
What matters is choosing one definition of an active customer and sticking to it. For example:
- Replenishment products: define churn based on missed reorder timing
- Subscription products: use cancellation or lapse status
- General ecommerce: define churn as no repeat purchase within your chosen retention window
This is also why interactive tools work well for ecommerce teams. They force clarity. A good interactive content marketing strategy doesn't just engage people. It helps them classify, compare, and act on their own data with less friction.
Going Deeper With Advanced Churn Analysis
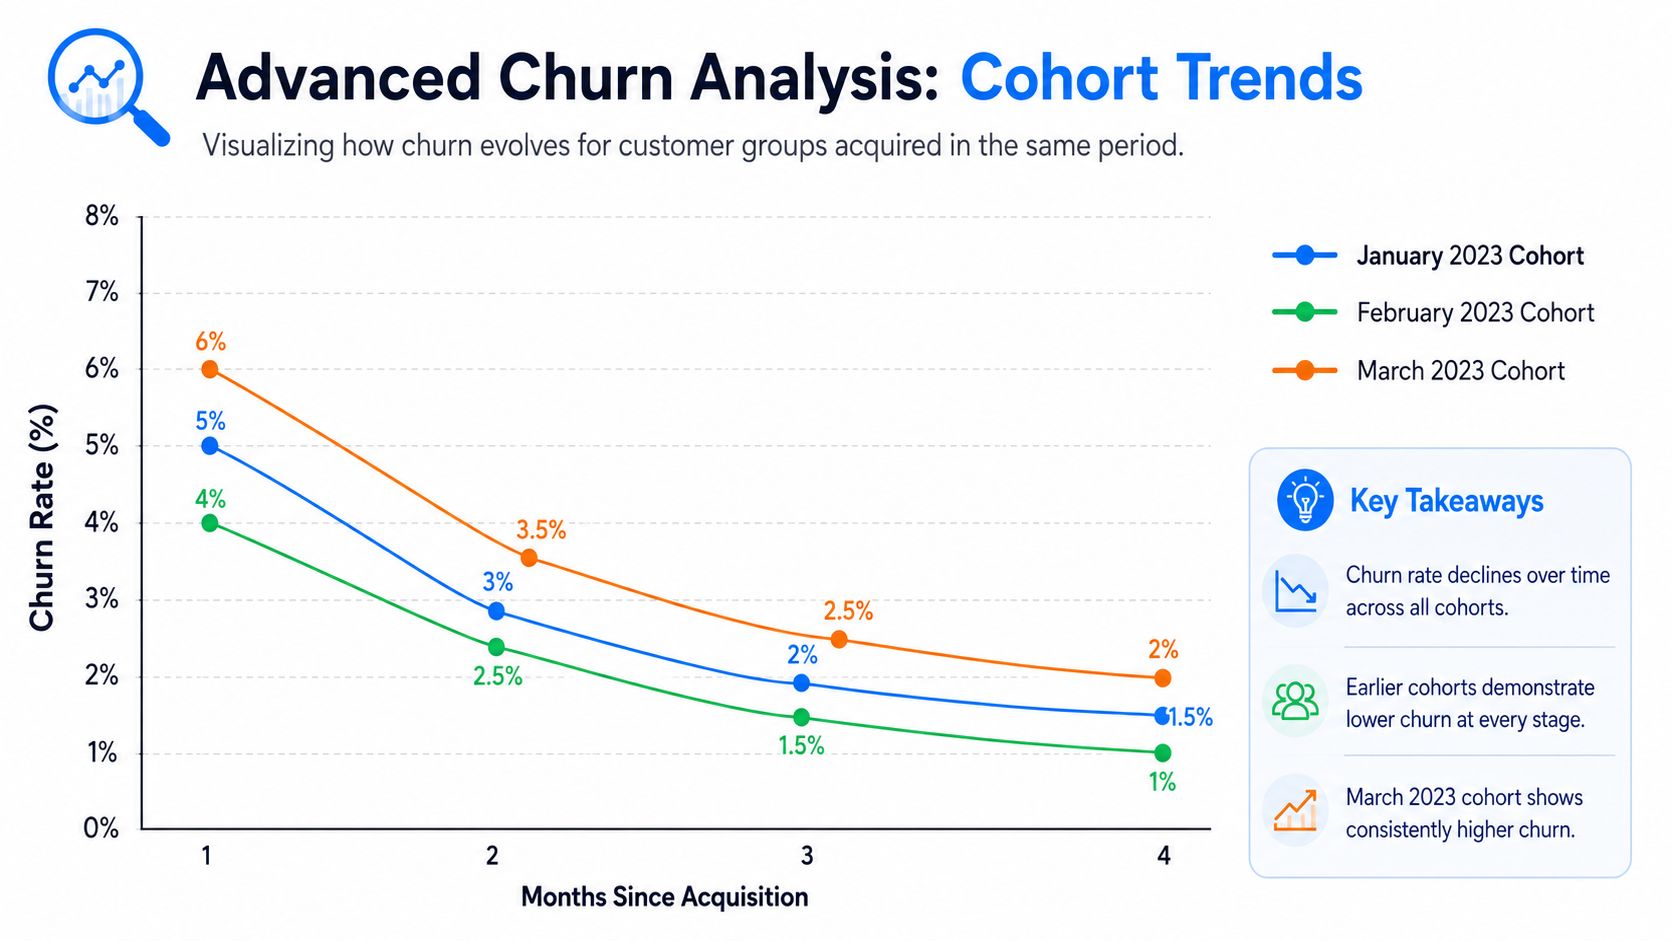
A single churn number is useful, but it hides as much as it reveals. If your overall rate looks stable, you might assume the store is healthy. Meanwhile, one acquisition source, one product line, or one promo cohort could be dragging retention down.
That's where advanced analysis starts to matter. You're no longer asking only how many customers left. You're asking which customers left, when they were acquired, and what behavior they shared before dropping off.
Why blended churn hides the real problem
Chargebee notes that even a 5% monthly customer churn rate can leave a business with approximately half the customers it started the year with, which shows how quickly attrition compounds (Chargebee churn benchmarks and compounding example). The same source says a good annual churn rate for established SaaS companies is often 5% to 7%, or roughly 0.4% to 0.6% monthly, while 10% and above is a warning sign.
Those figures come from SaaS, not Shopify retail. But the lesson carries over perfectly: small recurring losses create a major growth problem when they repeat month after month.
For ecommerce, blended churn can mislead you in a few common situations:
- Holiday cohorts look worse later: Customers acquired during heavy discount periods may behave very differently from full-price customers.
- Product categories churn at different rates: Replenishable items often retain differently than gift-driven or seasonal products.
- Channels bring different loyalty profiles: Paid social may acquire differently than search, affiliates, or organic email capture.
If you only measure sitewide churn, you'll often fix the wrong thing.
How cohort analysis changes your decisions
Cohort analysis groups customers by a shared starting point. In ecommerce, that usually means acquisition month, first product purchased, or first-touch campaign.
A simple example: compare customers acquired during a Black Friday sale with customers acquired in a normal month. If the sale cohort buys once and disappears, that doesn't automatically mean the campaign failed. But it does mean you should stop judging success only by first-order revenue.
Cohort analysis helps answer questions like:
- Did the first product create loyalty?
- Did the discount attract low-fit buyers?
- Did one landing page bring in better repeat customers than another?
Looking at cohorts usually ends the argument about whether a campaign “worked.” It replaces opinion with customer behavior over time.
You don't need advanced BI software to start. A spreadsheet with acquisition month rows and repeat purchase activity across later months is enough to reveal patterns.
What negative churn looks like in ecommerce
In subscription businesses, people talk about negative churn when expansion revenue from existing customers offsets losses from churned customers. Ecommerce stores can apply the same idea in spirit, even if the math is less formal.
Here's what that looks like operationally:
| Ecommerce behavior | Why it matters |
|---|---|
| A retained customer buys more often | Frequency lifts value without needing another acquisition cost |
| A retained customer moves into higher-value bundles | Average revenue per customer rises |
| Cross-sells increase after the first purchase | Existing customer value grows even if some customers drop off |
This is why churn and retention should never be isolated from merchandising. Upsells, replenishment reminders, bundles, and post-purchase recommendations don't just raise order value. They can offset the financial impact of customer loss from weaker segments.
How to Interpret Your Churn Rate and Avoid Common Pitfalls
A churn number by itself doesn't tell you whether your store is healthy. It only tells you that customers are leaving at some rate under some definition. If that definition is sloppy, the number won't help you.
The first interpretation problem is benchmarking. SaaSquatch reports that an ideal churn rate is 5% or below, while 10% and above is a warning sign. Those numbers are useful directional markers, but they still don't answer the Shopify owner's real question: “Is my store's churn acceptable for what I sell?” In ecommerce, that answer depends heavily on purchase cadence and business model.
A good churn rate depends on your model
A subscription box has a clear recurring expectation. Churn is direct and frequent. A consumables brand can often define expected reorder windows with confidence. A furniture or luxury gifting store can't use the same standard because buyers don't return on a fixed monthly rhythm.
That means your benchmark should start with your own business reality:
- Fast-repeat products: shorter retention windows and tighter churn definitions make sense
- Seasonal products: churn should be interpreted over a broader cycle
- High-consideration products: focus more on reactivation and customer value over time than a short-term inactivity label
What doesn't work is importing a subscription benchmark into a low-frequency retail model and treating it as gospel.
Mistakes that make churn numbers useless
The biggest interpretation mistakes are usually operational, not mathematical.
- Defining churn too loosely: If every buyer who doesn't purchase again quickly is labeled churned, you'll overreact and discount too aggressively.
- Ignoring segmentation: A storewide average can hide that one product line retains well while another burns through customers.
- Looking only at customer churn: If you don't compare it with revenue churn, you won't know whether the customers leaving were low-value or highly important.
- Changing the rules midstream: If one month uses a short inactivity window and the next month uses a longer one, trend lines become noise.
A short diagnostic table helps keep interpretation grounded:
| If you see this | Check this next |
|---|---|
| High customer churn, stable revenue | Are low-value one-time buyers leaving while top repeat customers stay? |
| Lower customer churn, weaker profitability | Are valuable customers spending less or disappearing quietly? |
| Big churn swings after promotions | Did the campaign attract discount-only buyers? |
| Flat growth despite strong acquisition | Are new customers replacing lost ones rather than adding to the base? |
Don't ask whether your churn rate is “good” in isolation. Ask whether it supports profitable growth for the way your store actually sells.
That question is far more useful.
From Calculation to Action 5 Ways to Reduce Ecommerce Churn
Knowing the number is the easy part. Lowering churn takes changes that improve the customer experience after the first order, not just before it.
The best retention work in ecommerce usually looks unglamorous. Better timing. Clearer messaging. Stronger post-purchase support. Smarter segmentation. More relevant offers. Those are the things that keep customers around.
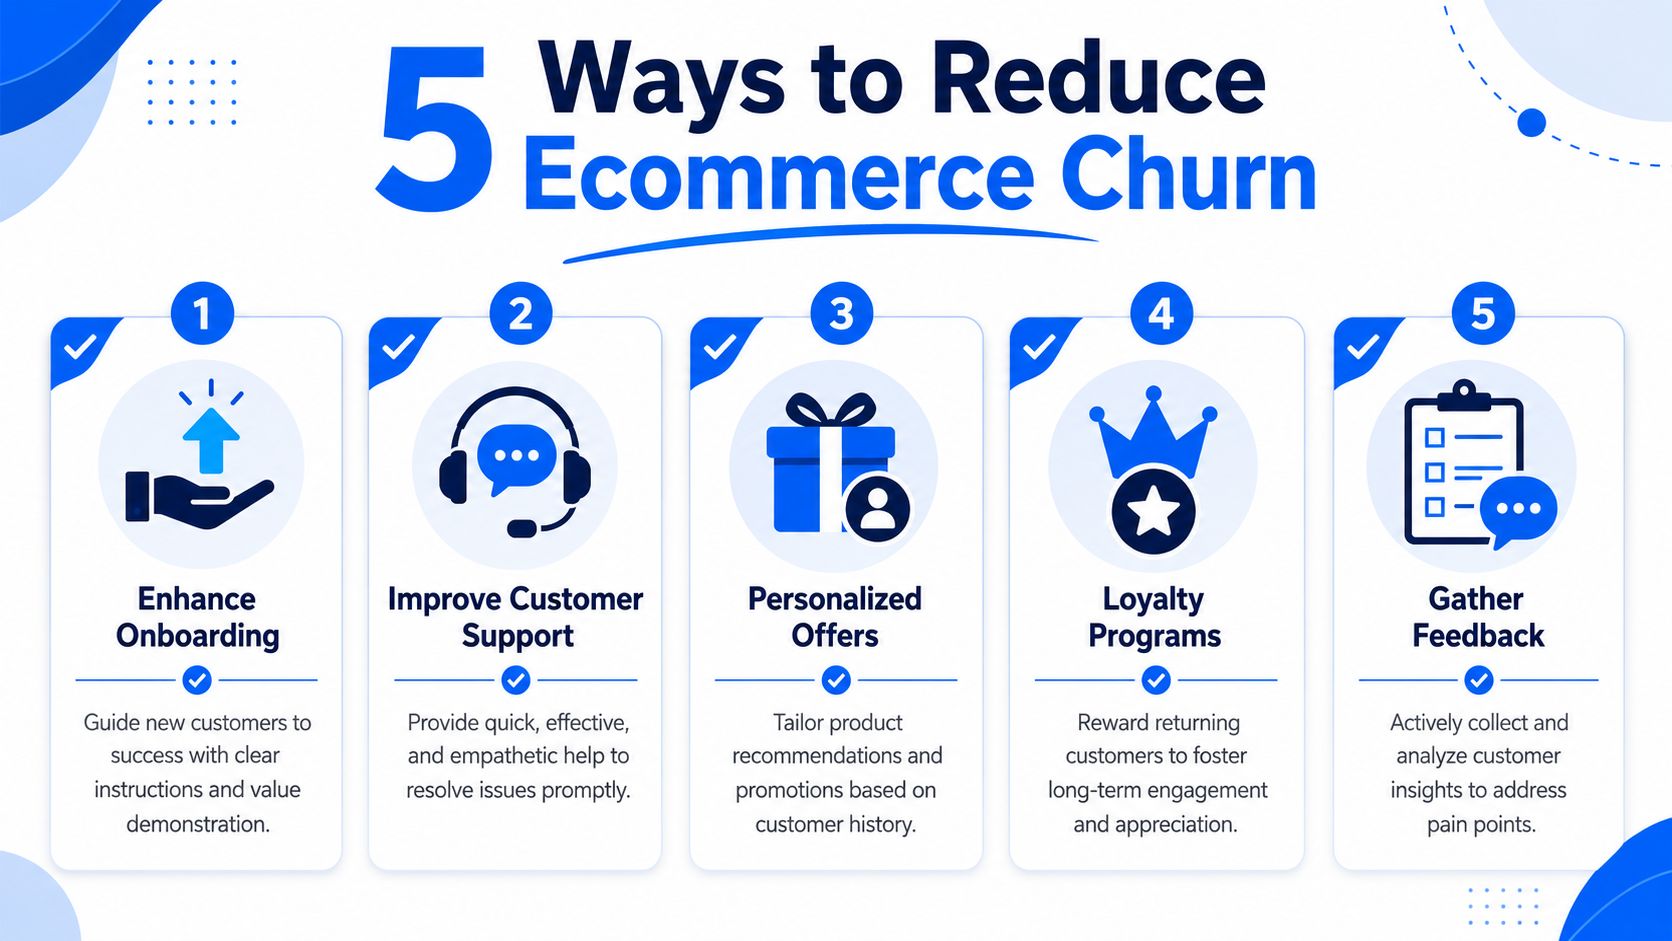
Five retention moves that actually help
Fix the post-purchase gap
Many stores work hard for the first conversion, then go quiet. Your order confirmation, shipping updates, product education, and follow-up sequence should all push toward confidence and the next purchase.Build a feedback loop
Customers often tell you why they leave, but most stores never collect the signal in a usable way. A simple system to get customer feedback for your ecommerce site can reveal whether churn is tied to shipping issues, product mismatch, support friction, or weak onboarding.Reward behavior you want more of
Loyalty programs, replenishment reminders, VIP perks, and early access can all support repeat purchasing. The point isn't to bribe every customer. It's to give your best-fit buyers a reason to keep choosing your store.Use win-back campaigns with real segmentation
Don't send the same “we miss you” email to every inactive customer. Split by product purchased, time since order, and likely reason for lapse. If you want outside ideas, this guide on how to reduce customer churn is a helpful reference for thinking through practical retention triggers.Make on-site engagement more useful
Generic popups and blanket discount bars don't do much for retention if they attract the wrong customers. Interactive offers, quiz-style experiences, and segmented capture flows can help you build a better email list and personalize follow-up in a way that supports long-term loyalty, not just the first sale.
The thread across all five is simple. Stores reduce churn when they stop treating retention as an email problem alone and start treating it as a full customer journey problem.
If you want a better way to turn store traffic into engaged subscribers and repeat buyers, SmashPops helps Shopify brands use gamified pop-ups to capture more emails, segment offers, and create retention-friendly on-site experiences without the usual generic popup fatigue.